


Live monitoring, alerts and KPIs for your Autodesk Vault Job Processors.
See what your automation is really doing, from one machine to a whole fleet.

- THE BLACK BOX
A file is released, a PDF is created, a DXF is exported, data flows to another system and all of it happens silently in the background. That silence is the whole point of automation. It's also the problem.
Is the Job Processor running right now?
Did last night's batch publishing succeed?
Why is that one PDF drawing msising?
Is the machine overloaded or is the job just slow?
Today, answering these means walking to the machine, remoting in, and reading local log files. The smaller your setup, the more familiar this failure mode is: the one Job Processor stops on Friday afternoon, and nobody notices until Monday, when three days of jobs are queued and engineers are blocked.
Background automation without visibility is a black box
You only open it after something has already gone wrong, such as a missing PDF, a blocked engineer, or a weekend nobody was watching.
- WHAT IS IT
Job Processor Cockpit is a coolOrange Labs prototype: a cloud-based web cockpit for your Autodesk Vault Job Processors. A small agent on each machine reports job, status and performance events to the cloud. You and your team sign in with your Autodesk ID and see, live, what is happening, what happened, and what needs attention
powerJobs and the Vault Job Processor keep doing the work exactly as before. The Cockpit only makes that work visible, measurable and alertable.
One machine means one blind spot and the Cockpit removes it. Several machines additionally get load comparison, per-machine KPIs, and a clean answer to "which machine?".
You and your team sign in with the Autodesk ID people already have.
Live
One or Many
JSON
OData
Status & alerts, updated as events happen
Machines, from a single processor to a fleet
Webhook alerts to Teams, Email or a flow
Read-only feed for PowerBi or reporting

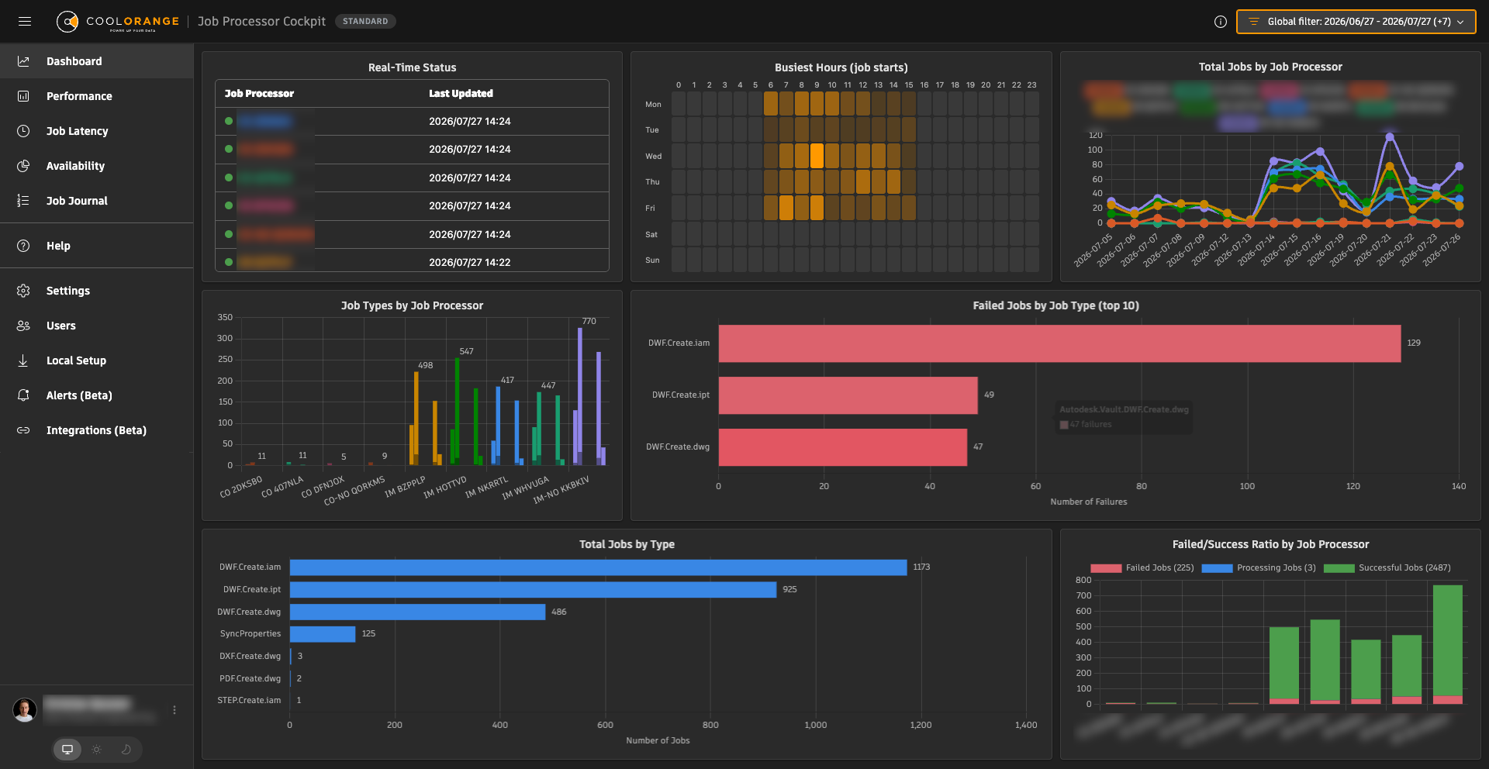
Processor status in real time, job success and failure ratios, failing job types, and a busiest-hours heatmap that shows when jobs pile up during the week.
Real-time status per processor
Busiest-hours heatmap by weekday
Answering 'Did the weekend run cleanly?' now takes one glance, not one log session.
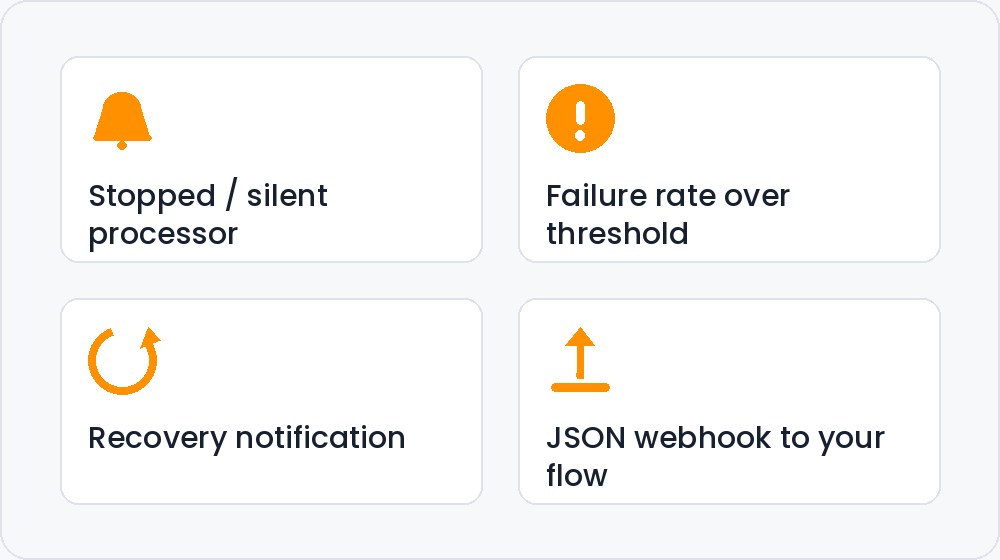
The Cockpit posts alerts as JSON to a webhook of your choice, for example a Power Automate flow that forwards them as email or Microsoft Teams messages.
Alerts when a processor stops or goes silent (crashed / unreachable)
Alerts when the failure rate crosses your threshold
A test button and documented sample payloads to build the flow fast


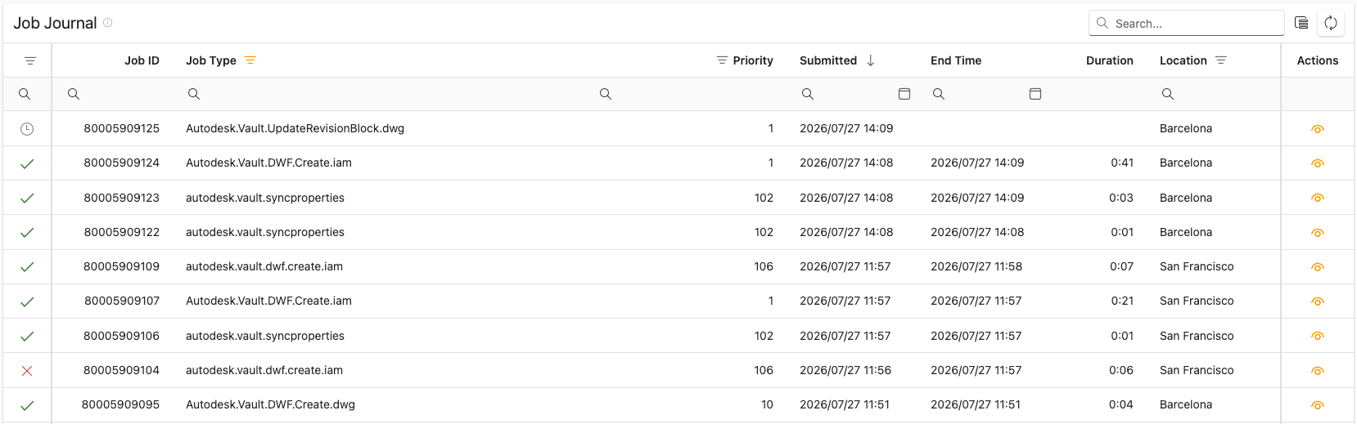
Every job execution in one searchable, filterable grid: status, timing, duration, machine, description and result message, with live row highlighting as new jobs arrive.
Search and filter every job across every machine
Open any job to inspect its parameters
No more remote session and log hunt for support cases
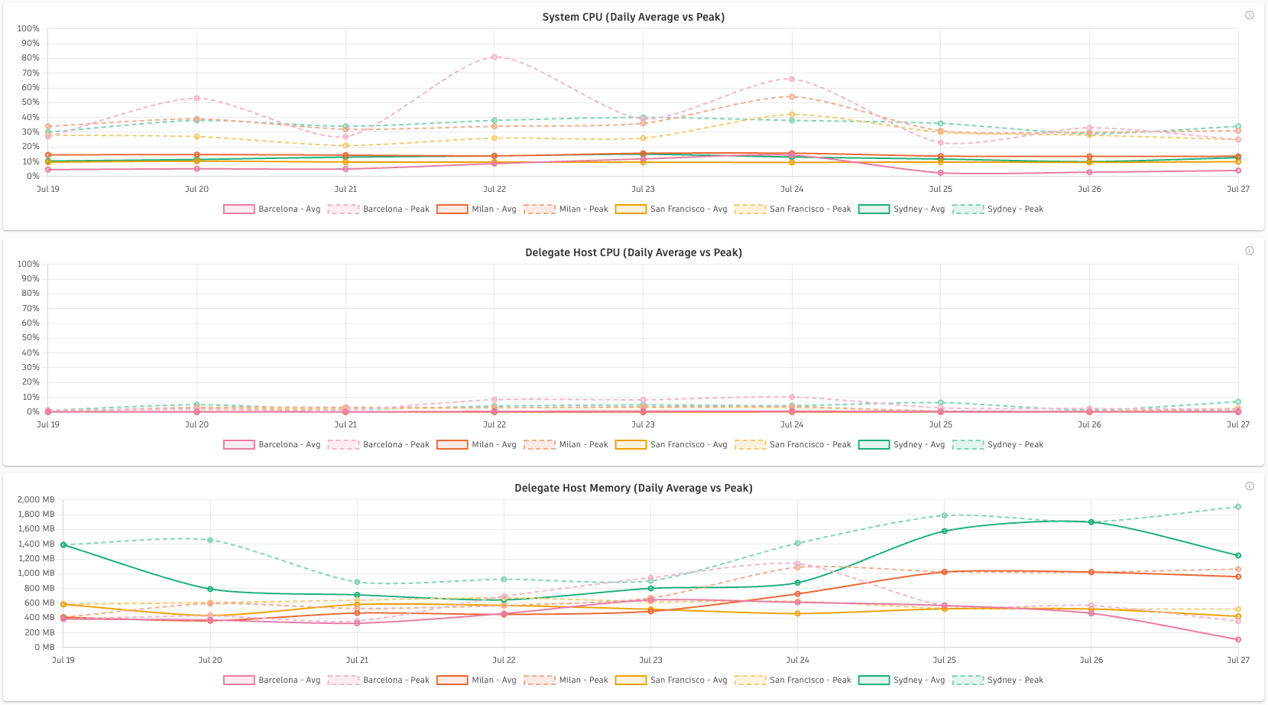
See daily average and peak CPU and memory for every Job Processor machine, covering both the machine as a whole and the Job Processor's own work.
System CPU vs. Delegate Host CPU & memory, side by side
Spot a memory leak as a growth trend, not an outage
Compare machines at a glance


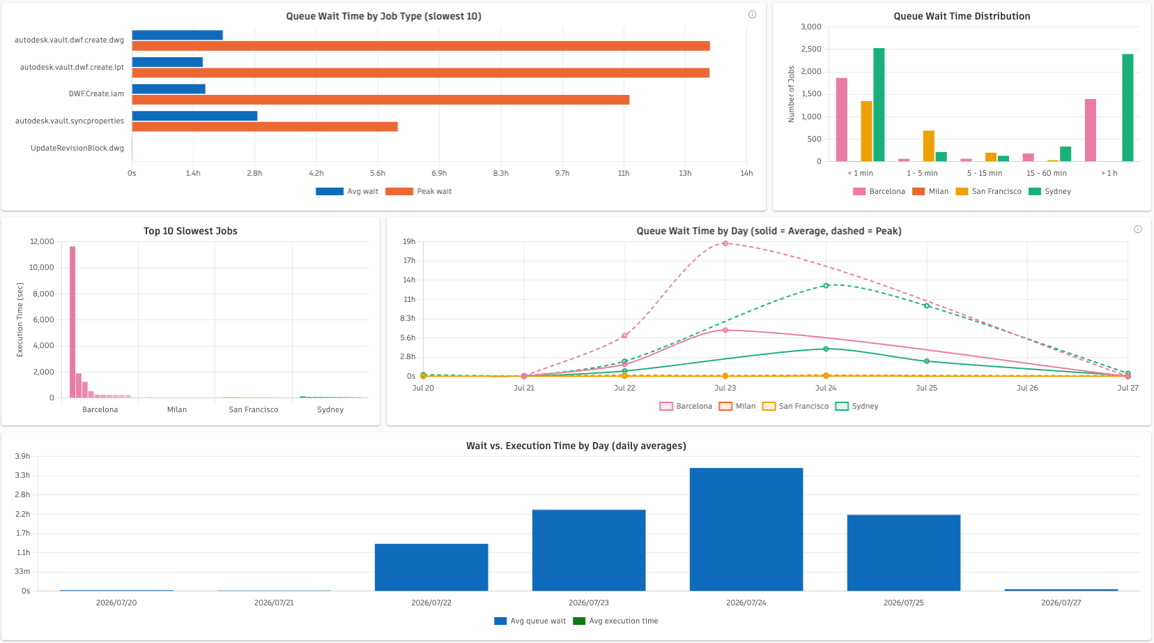
How long do jobs wait in the queue before a processor picks them up? Per day, per machine, per job type plus turnaround times and the top 10 slowest jobs
Rising queue wait flags capacity issues before users complain
Top 10 slowest jobs, by machine
The data behind the decision to add a second machine
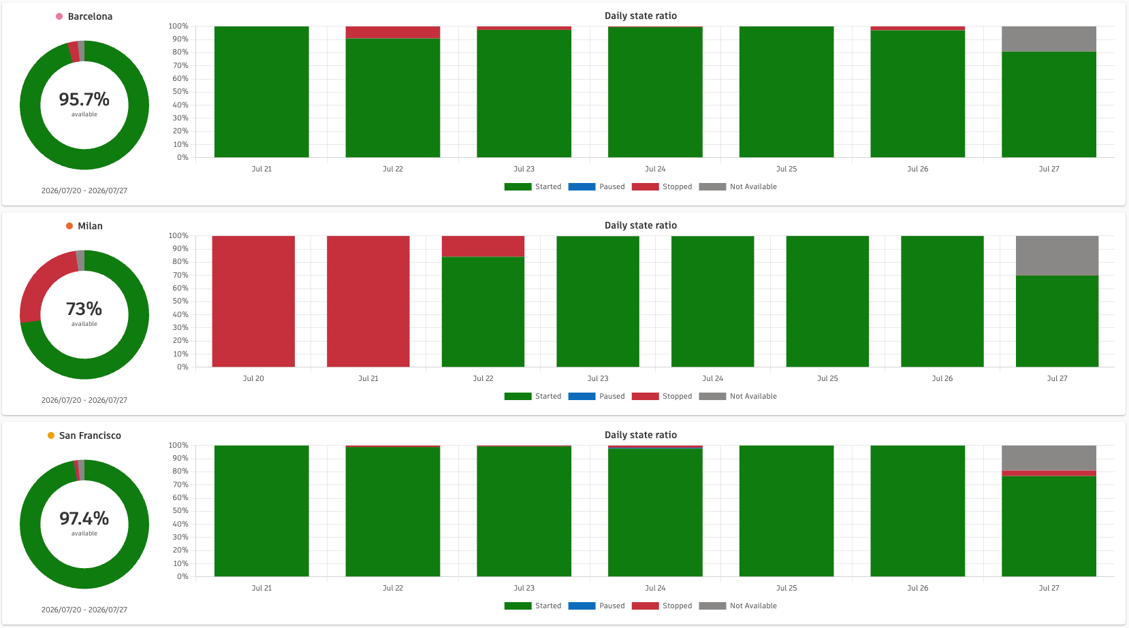
An availability percentage per machine, the share of time in each processor state, and daily breakdowns.
Recurring patterns jump out, every patch Tuesday
An automation uptime number your team can stand behind
Started / paused / stopped / not available, per day


A read-only OData feed exposes jobs (including duration and queue wait time), processors, and daily performance and availability rollups to any OData-capable client.
Built-in step-by-step guidance to connect Power BI, including scheduled refresh
Works with any OData-capable client
Read-only by design and nothing can write back into your data
08 - MADE FOR ENGINEERING TEAMS
Sign in with the Autodesk ID people already have. Admins manage users and roles themselves. Processors get friendly nicknames and colors used consistently across every chart so charts say "EDM Production", not "VM-JP-02".
Hardware swap? History merges into the successor machine
Years of job history stay in one line
Light and dark themes for a wall display or second monitor

- HOW IT WORKS
On each Job Processor machine, a lightweight agent watches job execution, processor state and machine performance, and posts events to a dedicated cloud ingestion endpoint using your account's access key.
Agent watches
Job execution, processor state and machine performance, locally on each machine.
Events posted to the cloud
Sent to a dedicated ingestion endpoint with your account's access key.
Stored durably, first
Events are accepted immediately and stored before processing, so a restart or deployment on the Cockpit side never punches holes in your job history.
Web app updates live
The same data feeds dashboards, KPIs, alerts, and the OData feed, in real time.

Security by design: each account keeps its own jobs, processors, users and keys. Consultants and multi-site organizations can switch between accounts in one cockpit.
- GETTING STARTED
On each Job Processor machine, a lightweight agent watches job execution, processor state and machine performance, and posts events to a dedicated cloud ingestion endpoint using your account's access key.
![]()
Contact Us
Reach out to get a test account for Job Processor Cockpit
![]()
Sign In
Sign in to the Cockpit with your Autodesk ID.
![]()
Install the agent
Copy your access key from the Local Setup page and run the agent installer on your Job Processor machine.
![]()
Watch it live
See your first jobs appear on the dashboard, then configure alerts so the Cockpit watches for you.
Job Processor Cockpit is a research prototype, not a shipping product. We built it to answer a question we hear from Vault and powerJobs customers of every size: "How do I know my job automation is healthy?"
It's stable enough to run against real environments, which is exactly the feedback we're looking for, but it comes without product-level maturity, support commitments, or availability promises. If visibility into your Job Processors would change your daily operations, we want to hear about your environment: how many machines, which job types, where it hurts.
- WANT TO TRY IT OUT?
Apply for a test account, monitor your job processing environment, and give us valuable feedback.