If are you looking for a smooth and effortless integration between Vault and your ERP
Join our upcoming webinar on May 31st
From API Confusion to Clarity
in Minutes
The smarter way to trace Autodesk Vault API calls.
Visualize. Understand. Replicate. Without guessing.

Working with Vault API? Then You Know the Pain!
If you’re building custom Vault workflows or extensions, you know the frustration.
The Vault API gives you functions and parameters but no clear path.
You run an action in Vault and ask yourself:
-
What actually happened in the background?
-
Which API calls were made, and in what order?
-
Why doesn’t my script deliver the same result?
Telerik Fiddler Classic is often the tool of choice to monitor HTTP/S traffic, butonce you open it, you’re staring at a wall of raw SOAP. No structure, no context. No clue what you're even looking at.
But here’s the catch: Fiddler isn’t optimized for Autodesk Vault.
You're left scrolling through lines of cryptic data, guessing your way forward. That’s where vapiTrace steps in.
What is vapiTrace?
vapiTrace, developed by COOLORANGE, reveals the full story of what happens when you interact with Vault. It captures and translates Vault’s internal API traffic into clear, structured information that helps you:
See exactly which API calls are being made without guesswork
Jump directly to the relevant SDK documentation
Generate ready-to-run PowerShell snippets to replicate or extend behavior.
Whether you’re building an integration, diagnosing an issue, or trying to understand Vault's inner workings, vapiTrace makes invisible workflows visible.
Why Do You Need vapiTrace?
vapiTrace, developed by COOLORANGE, reveals the full story of what happens when you interact with Vault. It captures and translates Vault’s internal API traffic into clear, structured information that helps you:
Whether you’re building an integration, diagnosing an issue, or trying to understand Vault's inner workings, vapiTrace makes invisible workflows visible.
Debugging time from hours to minutes
Instantly view server calls triggered by button clicks in Vault without assuming or searching through logs.
Accelerate onboarding and learning
New team members quickly grasp Vault's operations without needing to explore the SDK in depth.
Build automations that actually work
Generate real PowerShell snippets from real API calls. You’re not starting from scratch anymore.
Support users with precision
Diagnose customer environments or replicate issues by tracing exactly what happened.
Get Started with vapiTrace in just three simple steps:
Step 1: Download and install: Telerik Fiddler Classic.
Step 2: Download vapiTrace from the link below.
Step 3: Extract the vapiTrace ZIP file to:
%localappdata%\Programs\Fiddler\Inspectors
Once installed, restart Fiddler Classic to activate vapiTrace.
Using vapiTrace
Once Fiddler Classic is running and Vault is open, vapiTrace starts showing you all the HTTP traffic — including the SOAP API calls between Vault Client and Server.
Here’s how to get the most out of it
Use a Real Server Name, Not “localhost”
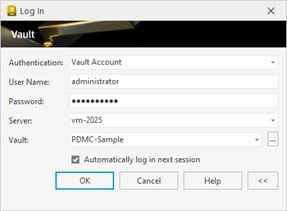
If Vault Client and Server are on the same machine, do not log in with “localhost”. Fiddler can’t trace it because .NET skips the proxy.
Instead, use your machine name or IP address.

Use the machine name in case Vault Client and Server is installed on the same machine
Filter the Traffic to Focus on Vault API Calls
Fiddler captures everything, including unrelated apps like Outlook or browsers.
To focus only on Vault traffic:
- Open the Filters tab
- Enable “Show only if URL contains”
- Add:
/AutodeskDM/

Locate the vapiTrace Inspectors Inside Fiddler
Once vapiTrace is installed, go to the Inspectors panel in Fiddler.
You will find two new tabs labeled vapiTrace:
- One in the Request section (top panel)
- One in the Response section (bottom panel)

When the tool detects HTTP or HTTPS traffic that is not from the Vault API, it will display a simple message:
“No valid Autodesk Vault SOAP request.”
However, when Vault traffic is present, vapiTrace will break it down into a clear and structured view that is easy to interpret.

Explore the Real Value of vapiTrace
Once vapiTrace detects a valid API call, it provides three powerful benefits right away
Readable Vault API Call Visualization
vapiTrace simplifies XML by clearly showing each call, including the function, parameters, and response.

Integrated SDK Documentation
vapiTrace shows Vault SDK info for each call, so you don't need to search for it; it's right in the inspector.

Start tracing your Vault API
calls like a pro!
Stuck with Vault debugging?
vapiTrace might be your new best friend.
We are interested in your feedback. Reach out to us with your questions, ideas & specific challenges.


