
Vault Automation & Job Processing
The Job Processor Cockpit gives teams running the Autodesk Vault Job Processor and powerJobs a central cockpit for job status, failures, queue latency, machine performance, availability, and alerts.
The Problem
Automated jobs are supposed to make work disappear.
A file is released in Autodesk Vault. A PDF is created. A DXF or STEP file is exported. Data is sent to another system. A notification goes out. Everything happens in the background, and that is exactly the point.
But as soon as automation becomes important, a new question appears: what is actually happening in the background?
For many teams, the answer is still spread across individual Job Processor machines, local logs, manual checks, and support conversations. A job may fail, but nobody notices until a user asks why their file is not ready. A script may take longer than usual. A machine may quietly fill up its memory.
And this is not just a "big fleet" problem. A company with a single Job Processor has the same blind spot as a company with ten. In fact, the smaller the setup, the more likely the classic failure: the one Job Processor stops on Friday afternoon, and nobody notices until Monday, when three days of jobs are queued and engineers are blocked.
If you are still deciding where that single machine should live, we cover the trade-offs separately in Where to Run the Vault Job Processor: Best Practices.
Without a central view, teams fall back to reactive troubleshooting:
- Walking over to the machine (or remoting in) just to see if it is still running.
- Searching through logs after a user reports a problem.
- Guessing whether a failed job is caused by the script, the Vault environment, or the machine itself.
- Debating whether a second Job Processor is needed, without any data.
The more successful your automation becomes, the more painful this gets. When Autodesk Vault jobs become part of daily production, visibility becomes just as important as automation itself.
The Solution
That is why we are working on Job Processor Cockpit, a COOLORANGE LABS technical preview for Autodesk Vault and powerJobs environments.
The idea is simple: give teams one place to see their Job Processor activity, understand what happened, and know about problems before users do.
Instead of opening different machines or reading technical logs, users get a web-based cockpit with live job information, dashboards, KPIs, alerts, and a searchable job history. Users sign in with their Autodesk ID, so there are no new accounts to manage.
It is not meant to replace your automation. It is meant to make your automation visible.
A Dashboard for Your Whole Job Processor Landscape
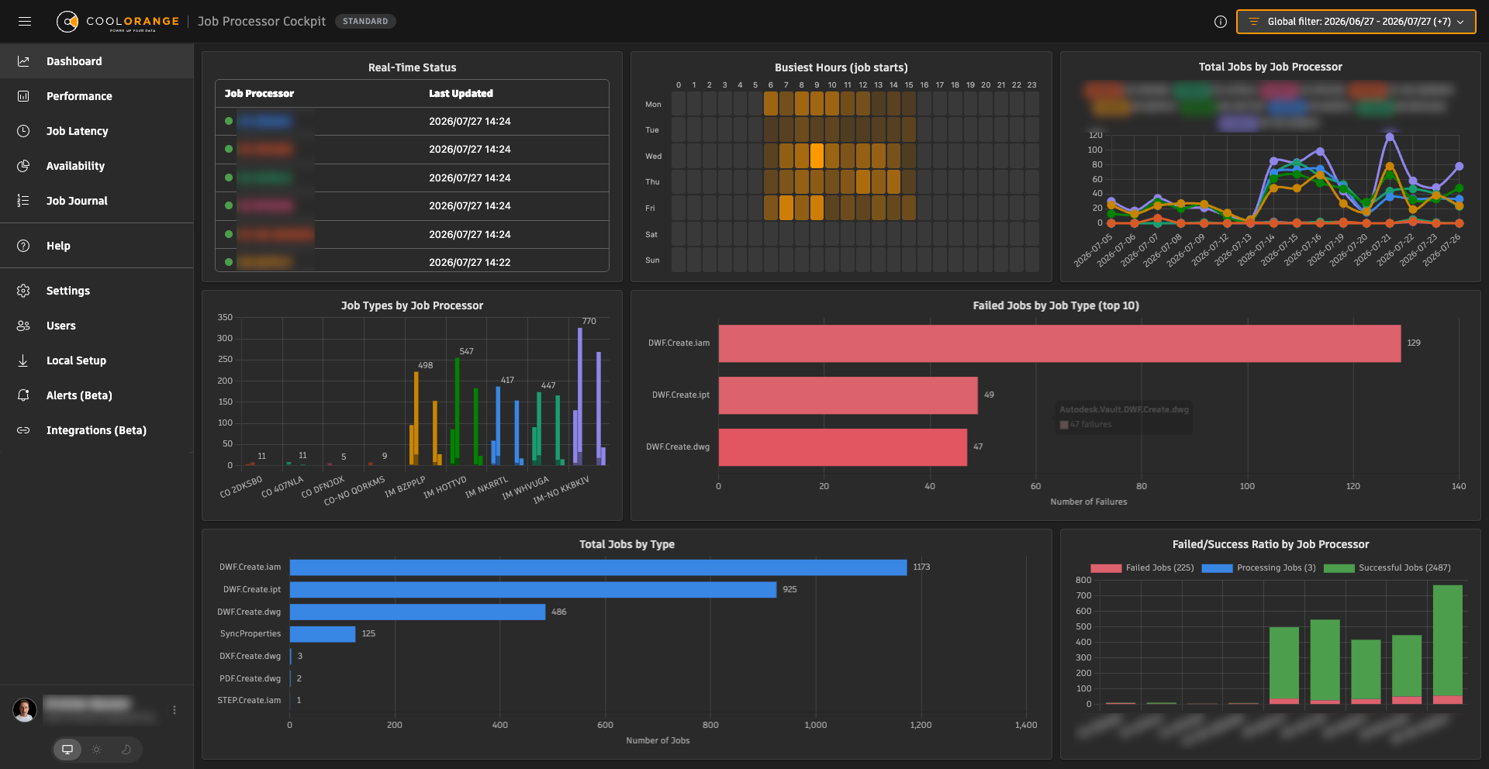
The dashboard shows the current situation at a glance: which Job Processors are active right now, how many jobs succeeded or failed, which job types fail most often, and a busiest-hours heatmap showing when jobs pile up during the week.
The use case is the Monday-morning check: did the weekend's batch publishing run cleanly, answered in one glance, before the first "where is my PDF?" email arrives. For a shop with one processor, this replaces the daily walk to the machine. For a fleet, it also shows which machine carries the load. And the heatmap helps schedule heavy batch work into quiet hours instead of the middle of the engineering day, the same idle windows we cover in Optimizing Vault Job Processor: Handling Idle Time.
Alerts That Find You
The cockpit can send alerts to a webhook, for example a Power Automate flow that forwards them as email or Microsoft Teams messages. It alerts when a Job Processor reports stopped or goes silent (crashed or unreachable machine), when the failure rate within a time window gets too high, and it sends a recovery notification when the processor comes back.
This solves the Friday-afternoon problem directly: instead of discovering a stopped processor on Monday, the responsible person gets a Teams message within minutes. The cockpit watches the machine so nobody has to. For teams of any size, this is the shift from "we notice when users complain" to "we know before users notice."
A Job Journal for Real Investigation
The Job Journal lists individual job executions in a searchable, filterable table, with status, timing, duration, machine, and result message. Each job can be opened to inspect its details and parameters.
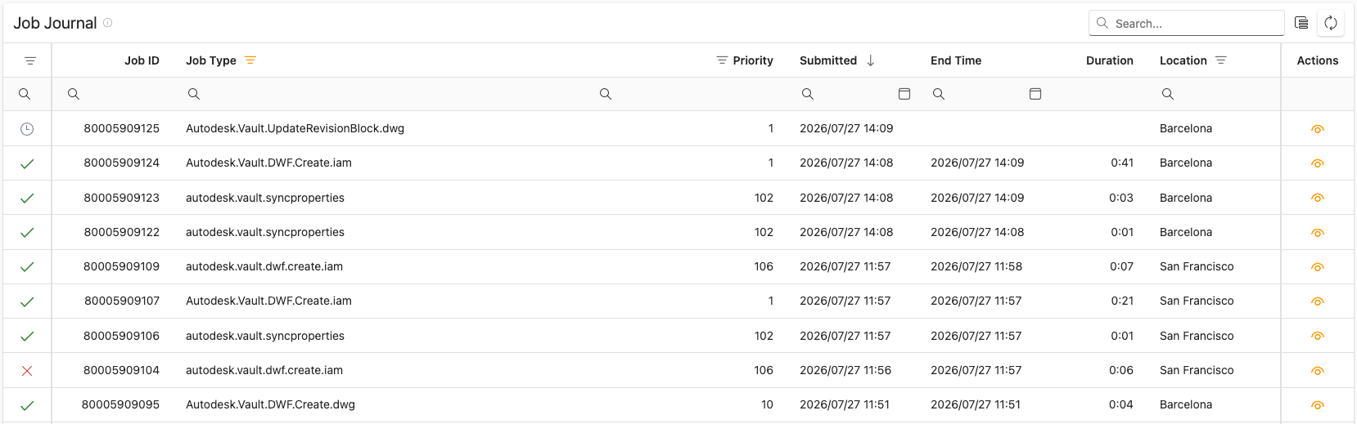
The use case is the everyday support call: a user reports "the drawing PDF never appeared." Instead of remoting into the Job Processor machine and scrolling through log files, the admin searches the journal, finds the failed job, and reads the result message. The whole investigation happens in the browser in under a minute. And when a job type fails only for certain files, comparing the parameters of a failed and a succeeded job turns a vague bug report into a concrete answer.
Tell an Overloaded Machine
From a Busy One
Performance trends show daily average and peak CPU and memory for every Job Processor machine, both for the machine as a whole and for the Job Processor's own work.
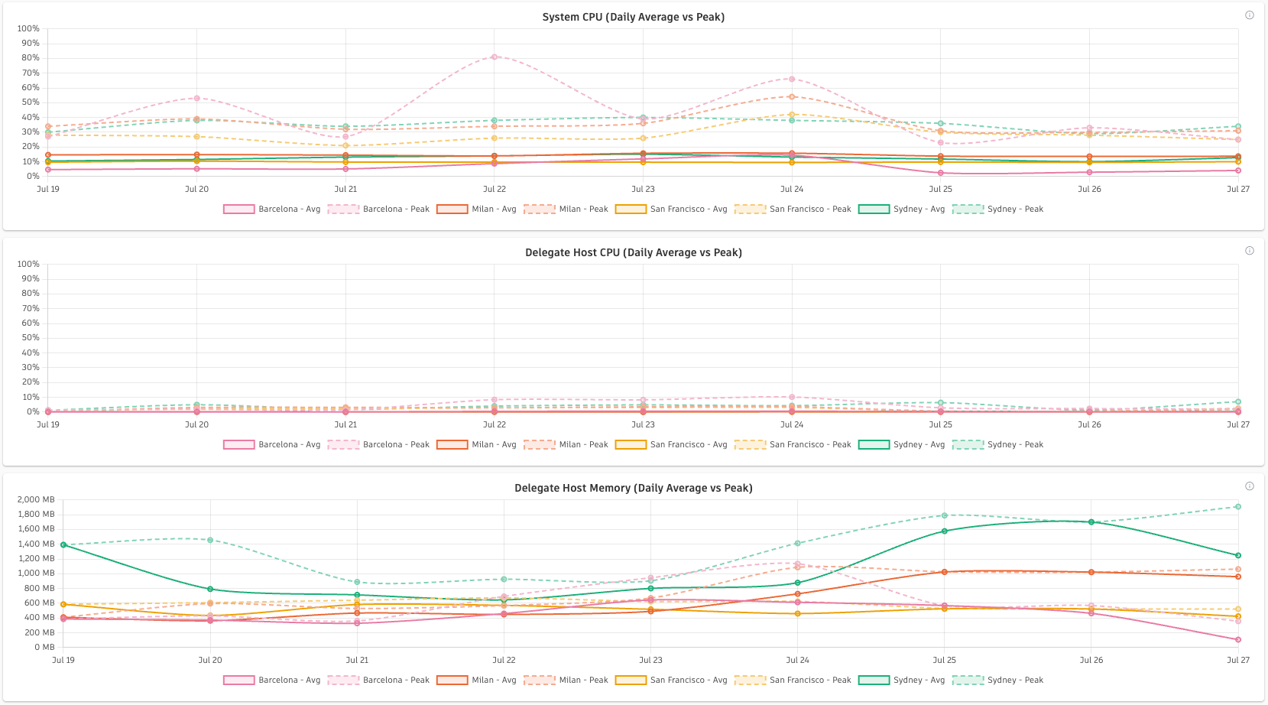
The use case: jobs have been getting slower for weeks, and IT asks whether the machine needs more resources. The trends show whether CPU is genuinely maxed out or whether memory is creeping upward, a growth trend that reveals a leak before it causes an outage. Capacity discussions become data-driven instead of guesswork, whether you run one machine or ten.
Know Whether Your Processors Keep Up
The latency KPIs show how long jobs wait in the queue before a processor picks them up, per day, per machine, and per job type, plus turnaround times and the top 10 slowest jobs.
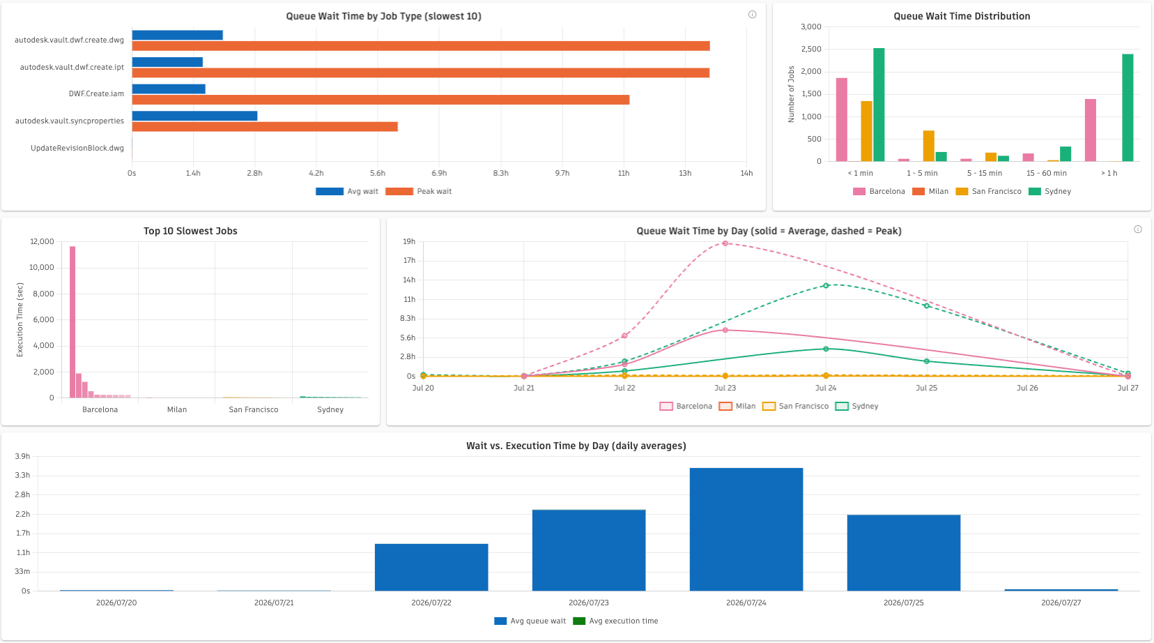
This answers a question every team eventually faces: engineers say released drawings take "forever," but is the job actually slow, or did it sit in the queue for 40 minutes first? For a one-processor shop, rising queue wait time is the earliest, clearest signal that it is time for a second machine, visible in data long before frustration builds. For larger setups, it shows which workloads pile up on which machine.
An Availability Number You Can Stand Behind
The availability KPIs show how long each Job Processor was actually up: an availability percentage per machine, the time spent in each state, and daily breakdowns.
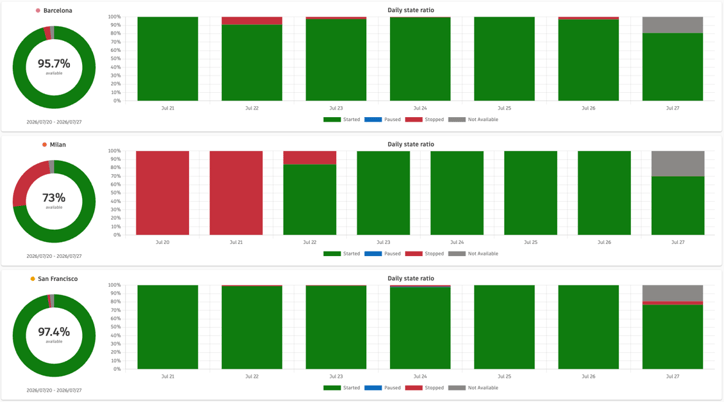
When a processor is found stopped, the daily breakdown answers "since when?" It went down Friday evening, which explains the backlog and gives IT a precise window to correlate with Windows updates or reboots. Recurring patterns, such as the processor dying every patch Tuesday, jump out. And over time, the availability percentage becomes a number a team can report to management: "our job automation was up 99% of working hours."
What This Means for Your Team
Job Processor Cockpit is built around a practical idea: automation should not become a black box.
With the beta, teams can:
- See their Job Processors, one or many, in one place, live.
- Get alerted when a processor goes down or failures spike, instead of finding out from users.
- Investigate individual jobs without hunting through local logs.
- See whether jobs wait too long in the queue, and decide on capacity with data.
- Distinguish overloaded machines from slow scripts.
- Put a defensible availability number on their automation.
For customers already using powerJobs or the Autodesk Vault Job Processor, this makes daily operations calmer. Fewer blind spots. Faster troubleshooting. Better conversations between engineering, CAD administration, and IT.
Summary
Automation is valuable because it removes repetitive work. But once automation becomes part of production, teams need visibility, and they need to hear about problems before their users do.
Job Processor Cockpit brings that visibility into one central web experience: live status, alerts, job history, queue latency, machine performance, availability KPIs, and reporting integration, readable for both technical and non-technical users, and just as useful for a single Job Processor as for a whole fleet.
This is a COOLORANGE LABS technical preview, so we are especially interested in feedback from real Vault and powerJobs environments.
.jpg)
.jpg)